Daily Tech Briefing
AI 科技速览
每天 5 分钟内学习 AI。获取最新的人工智能新闻,理解其重要性,并学习如何将其应用于您的工作。
AWS ML Blog · 2026/7/31 15:33:11
Optimizing production agents with Amazon Bedrock AgentCore Observability
AI 中文解读
亚马逊新推出了一套AI性能优化工具,专治"AI助手反应太慢"的毛病。过去,工程师调试AI代理时,只关心它会不会出错、能不能干活;但到了实际应用阶段,问题变成了效率——明明功能都正常,响应却从2秒拖到10秒,用户等得不耐烦,后台内存还在悄悄膨胀。AWS的AgentCore可观测性功能,配合CloudWatch监控,就像给AI装上了"体检仪",能精准定位到底是哪一步拖慢了速度、哪段对话吃掉了太多内存,还能在用户察觉前提前预警。这套方案的意义在于,AI不能只在演示时聪明,更要经得起真实世界的考验。对普通用户来说,以后用AI客服或智能助手,等待时间会更短,对话更流畅;对企业而言,则意味着更低的算力成本和更高的用户留存。简单说,就是让AI从"能用"升级到"好用",不再让人对着转圈圈的进度条干着急。
<p>As your AI agents move from prototype to production, the challenges shift from getting them to work to keeping them fast and efficient. In <a href="https://aws.amazon.com/blogs/machine-learning/debugging-production-agents-with-amazon-bedrock-agentcore-observability/" target="_blank" rel="noopener">Part 1</a> of this series, we walked through debugging two common agent failures: infinite loops and tool invocation errors. Those scenarios dealt with agents that were broken. In this post, we tackle a different challenge: agents that work correctly but perform poorly. Slow response times and unbounded memory growth are the most common operational issues that surface after you resolve the initial debugging problems. They don’t trigger error alerts, but they erode user trust and increase costs over time.</p>
<p>Using <a href="https://docs.aws.amazon.com/bedrock-agentcore/latest/devguide/observability.html" target="_blank" rel="noopener">AgentCore Observability</a>, a capability of Amazon Bedrock AgentCore, and <a href="https://aws.amazon.com/cloudwatch/" target="_blank" rel="noopener">Amazon CloudWatch</a>, you will learn how to identify performance bottlenecks across your agent’s execution path and diagnose memory issues in long-running sessions. You will also implement monitoring practices that catch degradation before users notice it. For additional information and best practices, review <a href="https://docs.aws.amazon.com/bedrock-agentcore/latest/devguide/evaluations.html" target="_blank" rel="noopener">AgentCore Evaluations</a>, a capability of Amazon Bedrock AgentCore, and <a href="https://docs.aws.amazon.com/bedrock-agentcore/latest/devguide/insights.html" target="_blank" rel="noopener">AgentCore Insights</a>.</p>
<h1>Prerequisites</h1>
<p>You need an AWS account with Amazon Bedrock AgentCore access, CloudWatch Transaction Search enabled, and a deployed agent. See Part 1 for full setup details.</p>
<h2 id="scenario-3-performance-bottlenecks">Scenario 3: Performance bottlenecks</h2>
<p>Agents experience performance bottlenecks when they work correctly but respond too slowly. You expect sub-second responses but experience multi-second delays. Agents complete tasks successfully, but the latency makes them impractical for interactive use cases. This scenario is particularly challenging because <em>slow</em> is subjective. What’s acceptable for a batch processing agent is unacceptable for a customer service chatbot. You must establish performance budgets for your specific use case, then systematically identify which components violate those budgets.</p>
<h3 id="symptoms-to-watch-for">Symptoms to watch for</h3>
<p>Performance degradation often manifests gradually. Agents might start with acceptable 2-second response times, but as you add features, integrate more tools, or accumulate more memory, latency creeps to 5 seconds, then 10, then becomes unusable. P95 response times exceed your thresholds, users abandon sessions, but error rates stay low. The agent works correctly but responds too slowly.</p>
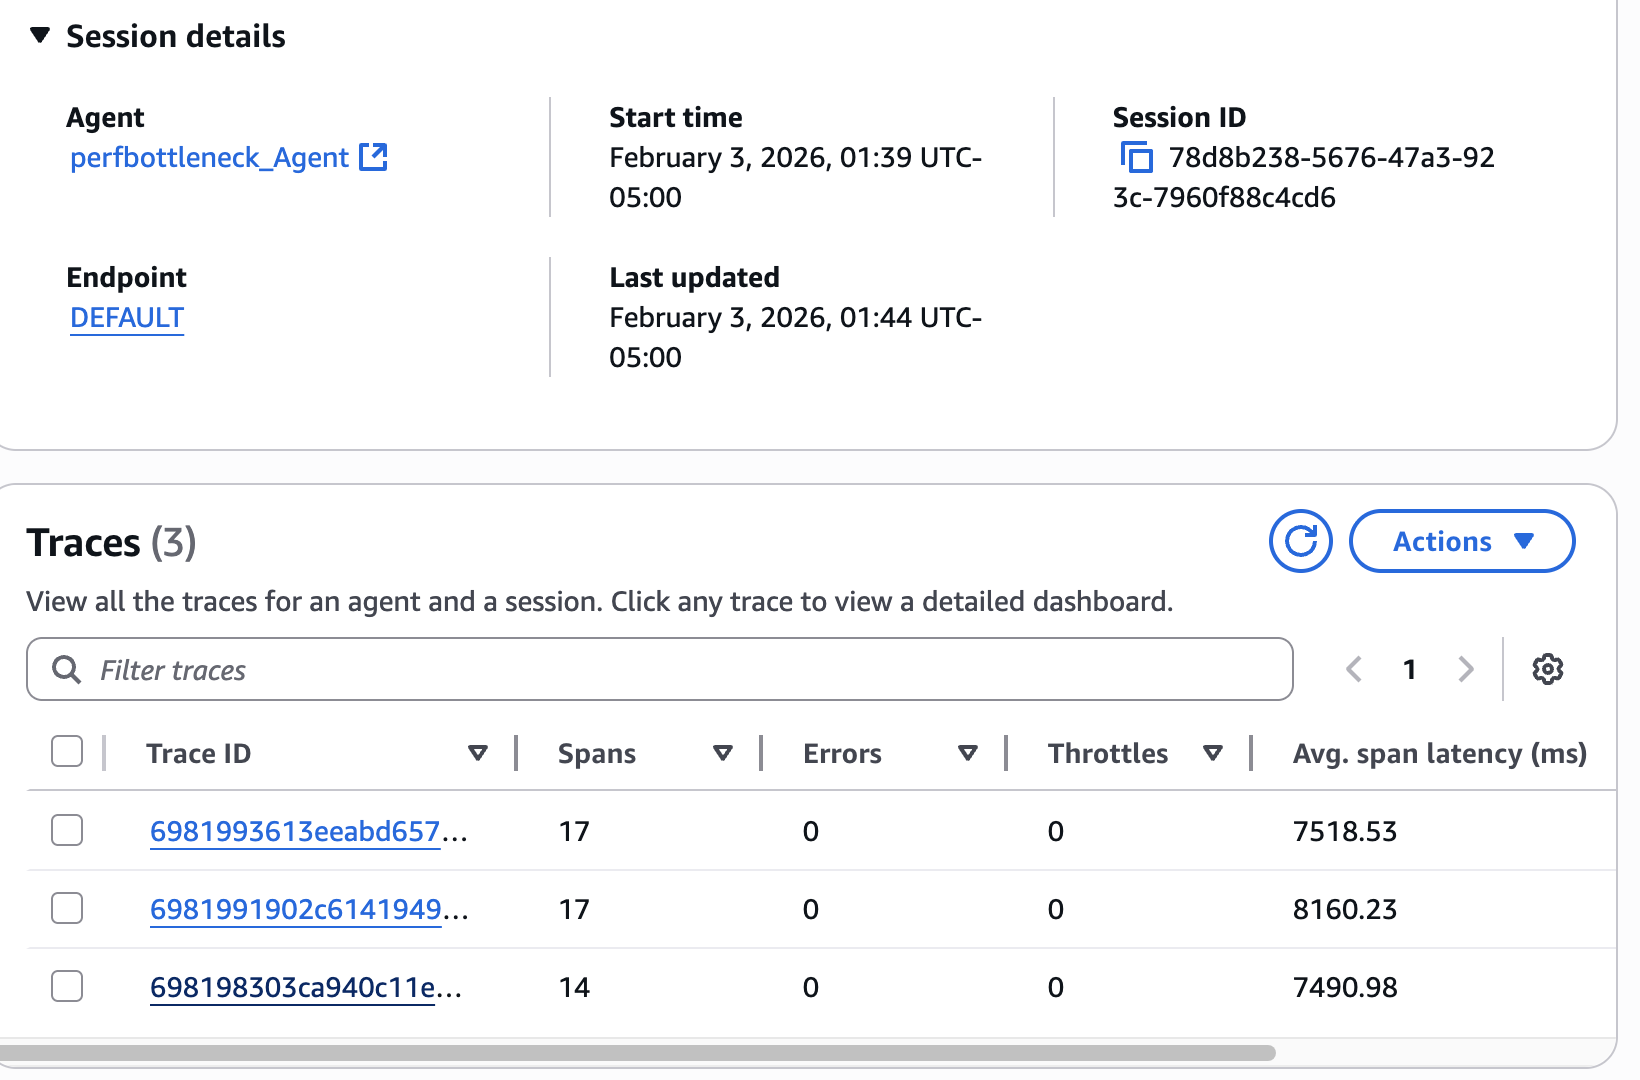
<p><img src="https://d2908q01vomqb2.cloudfront.net/f1f836cb4ea6efb2a0b1b99f41ad8b103eff4b59/2026/07/30/ML-20467-1.png" alt="CloudWatch session view showing three agent invocations with high 7.5-8.2 second span latency" width="800"></p>
<p><em>Figure 1 — Session details showing multiple traces with consistently high latency. The three invocations took 7.5-8.2 seconds (average span latency), demonstrating a systemic performance bottleneck rather than occasional slowness. This pattern indicates the agent’s architecture needs optimization.</em></p>
<p>To find bottlenecks, start by identifying high-latency requests. Query CloudWatch for agent invocations that exceed your performance budget:</p>
<div class="hide-language">
<pre><code class="language-plaintext">fields @timestamp, RequestId, Latency
| filter Operation like /InvokeAgent/
| filter Latency > 3000
| sort Latency desc
| limit 50</code></pre>
</div>
<p>This query r
分享
阅读原文 ↗